from akr_3d_map.grid_3d import Cartesian
# 3. Performing analysis and generating plot
cart = (
Cartesian()
.create_grid()
.add_burst_count(wind_data, coord_colnames=("x_gse", "y_gse", "z_gse"))
.add_observation_time(wind_data, coord_colnames=("LT_gse", "radius", "lat_gse"))
.add_residence_time(residence_data, coord_colnames=("x_gse", "y_gse", "z_gse"))
.plot_3d(
variable="burst_count |residence_time | residence_time",
path="plot_save_path",
show_earth=True,
earth_image_path_str="/temp.jpg",
show_sun=False,
)
)AKR 3D Map
Sudipta Kumar Hazra
Dublin Institute for Advanced Studies (DIAS)
Alexandra Ruth Fogg
Dublin Institute for Advanced Studies (DIAS)
March 30, 2026
Introduction
- 2D Foundation: Morioka et al. (2011) defined the geometric boundaries for AKR illumination and shadow zones in 2D space.
- AKR Burst Isolation: Fogg et al. (2022) extracted a decade of discrete AKR “burst” events from the NASA Wind/WAVES archives.
- 3D Evolution: Our project integrates these into a 3D Python tool, enabling spatial mapping and AKR visibility analysis in 3D space.
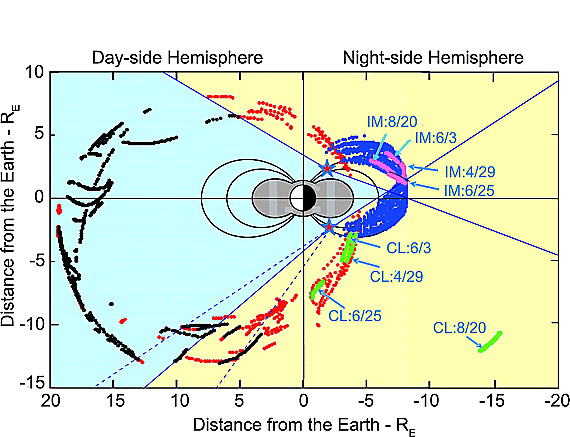
Image source: Morioka et al. (2011)
Development Roadmap
How the code work
Cartesian
LTRMlat
from akr_3d_map.grid_3d import LTRMLat
# 3. Performing analysis and generating plot
ltrmlat = (
LTRMLat()
.create_grid()
.add_burst_count(wind_data, coord_colnames=("x_gse", "y_gse", "z_gse"))
.add_observation_time(wind_data, coord_colnames=("LT_gse", "radius", "lat_gse"))
.add_residence_time(residence_data, coord_colnames=("x_gse", "y_gse", "z_gse"))
.plot_3d(
variable="burst_count |residence_time | residence_time",
path="plot_save_path",
show_earth=True,
earth_image_path_str="/temp.jpg",
show_sun=False,
)
)Coding architecture
%%{init: {'theme': 'base', 'themeVariables': { 'fontSize': '20px' }}}%%
classDiagram
direction TB
class FeatureCalculations {
<<Mixin>>
+add_burst_counts()
+add_observation_time()
+add_residence_time()
}
class AKRGrid {
<<Base>>
+data_source
+common_method()
+load_catalog()
}
class Cartesian {
+x_y_z_coordinates
+RE_units
+get_grid_terminology()
}
class LTRMLat {
+lt_radial_lat_coordinates
+spherical_units
+get_grid_terminology()
}
%% Relationships
FeatureCalculations <|-- AKRGrid : Provides Features
AKRGrid <|-- Cartesian : 3D Cartesian Map
AKRGrid <|-- LTRMLat : 3D Spherical Map
Cartesian: 3D Plots for Burst Count
LTRMlat: 3D Plots for Burst Count
Other plots are at:
Refrences
Fogg, A. R., C. M. Jackman, J. E. Waters, et al. 2022. “Wind/WAVES Observations of Auroral Kilometric Radiation: Automated Burst Detection and Terrestrial Solar Wind - Magnetosphere Coupling Effects.” Journal of Geophysical Research: Space Physics 127 (5): e2021JA030209. https://doi.org/https://doi.org/10.1029/2021JA030209.
Morioka, A., Y. Miyoshi, F. Tsuchiya, et al. 2011. “On the Simultaneity of Substorm Onset Between Two Hemispheres.” Journal of Geophysical Research: Space Physics 116 (A4). https://doi.org/https://doi.org/10.1029/2010JA016174.
Image credit: https://www.met.ie/education/the-northern-lights